Sunday, July 11, 2010
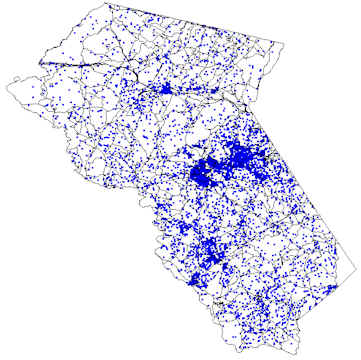
Dot Distribution
This a dot distribution map of Virgina showing the population distribution across the country side. The data used for this map was 2000 census data and when compared to historical data they found that the distribution is the same as in the 1900 census, however this map shows that there are twice as many dots which represent rapid growth in population density. 
Subscribe to:
Post Comments (Atom)

No comments:
Post a Comment